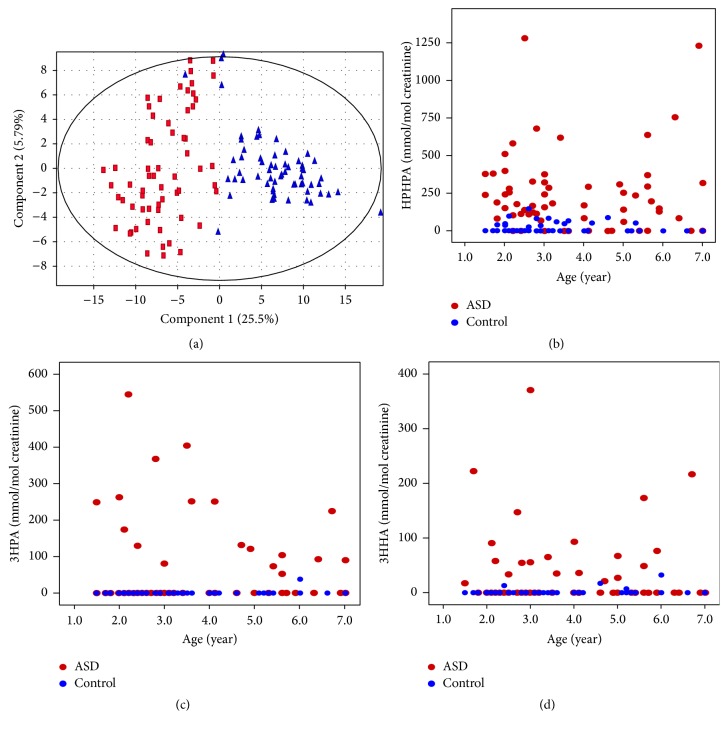
Figure 2.
PCA scores plot and distributions of the three compounds. (a) PCA scores plot of the ASDs group from the control group. Triangles represent the ASDs cases and squares represent the control cases. (b) Distribution of urinary HPHPA concentration by age between ASDs and control subjects. (c) Distribution of urinary 3HPA concentration by age between ASDs and control subjects. (d) Distribution of urinary 3HHA concentration by age between ASDs and control subjects.

