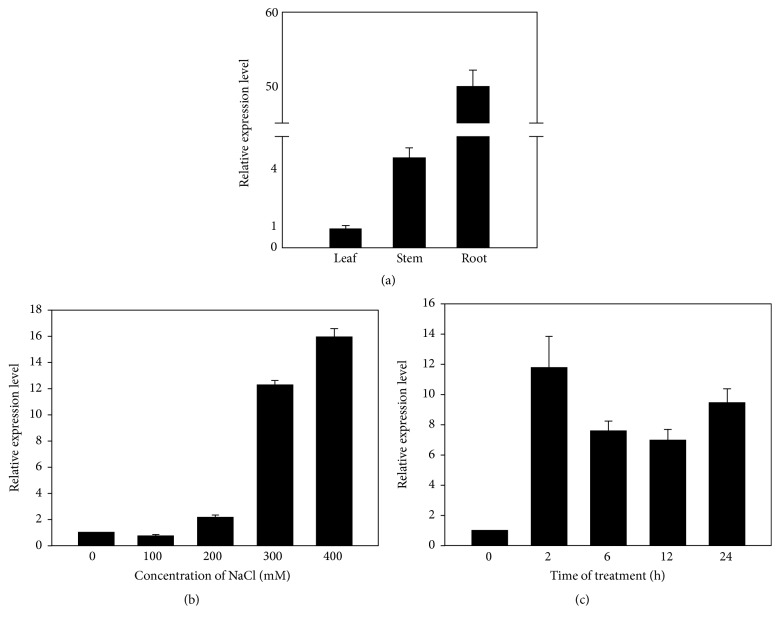
Figure 2.
The expression patterns of KvLEA gene in different tissues and under salt stress. (a) The expression levels of KvLEA in different tissues. Root, stem, and leaf were collected from seedlings growing under normal condition and total RNA was extracted from them, respectively. The expression quantity in leaf which was the smallest among three samples was set as the reference. The expression levels of the other two were the relative expression levels compared to leaf. (b) The transcripts accumulation of KvLEA under different NaCl concentrations (0, 100, 200, 300, and 400 mM). The 0 mM NaCl treatment was the control sample treated with the same nutrition solution without any NaCl. (c) The transcripts accumulation of KvLEA at different time of salt stresses (0, 2, 6, 12, and 24 h after salt treatment). The 0 h treatment was the corresponding control sample. The samples of NaCl treatment were the whole seedlings. Three biological replicates were performed and the mean values of the three biological replicates were used for plotting. Error bar indicates standard error (SD, n = 3).

