Figure 6.

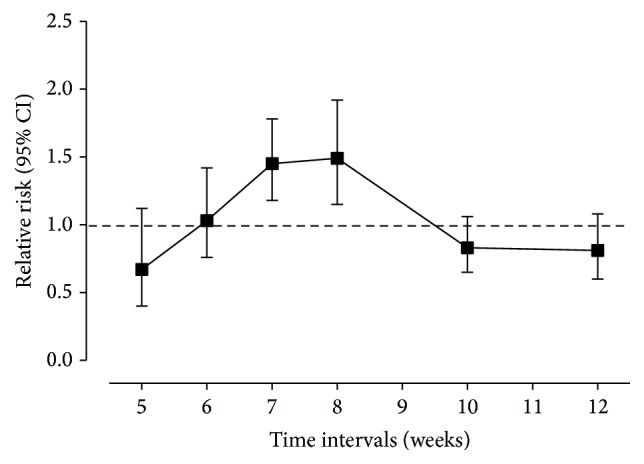
The relationship between time intervals and RR of pCR rates. The center of each black square is placed at the summary point estimate, and each vertical line shows the 95% confidence interval about the summary estimate.

The relationship between time intervals and RR of pCR rates. The center of each black square is placed at the summary point estimate, and each vertical line shows the 95% confidence interval about the summary estimate.