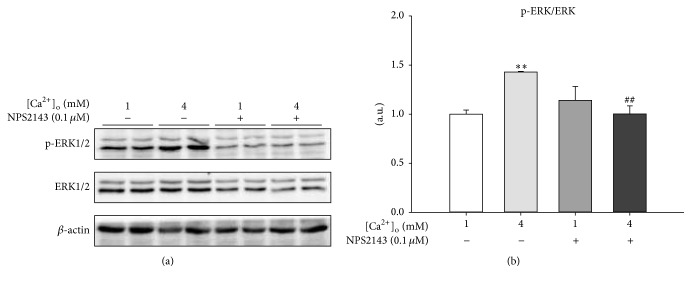
Figure 4.
[Ca2+]o activated ERK1/2 during the proliferation of pBMSCs. (a) Western blot analysis of phosphor-ERK (p-ERK) and ERK in pBMSCs after 5-day culture. β-actin was used as loading control. (b) Mean ± SEM of immunoblotting bands of p-ERK/ERK; the intensities of the bands were expressed as the arbitrary units (n = 4). ∗∗ P < 0.01 versus 1 mM [Ca2+]o group (control); ## P < 0.01 versus 4 mM [Ca2+]o group.

