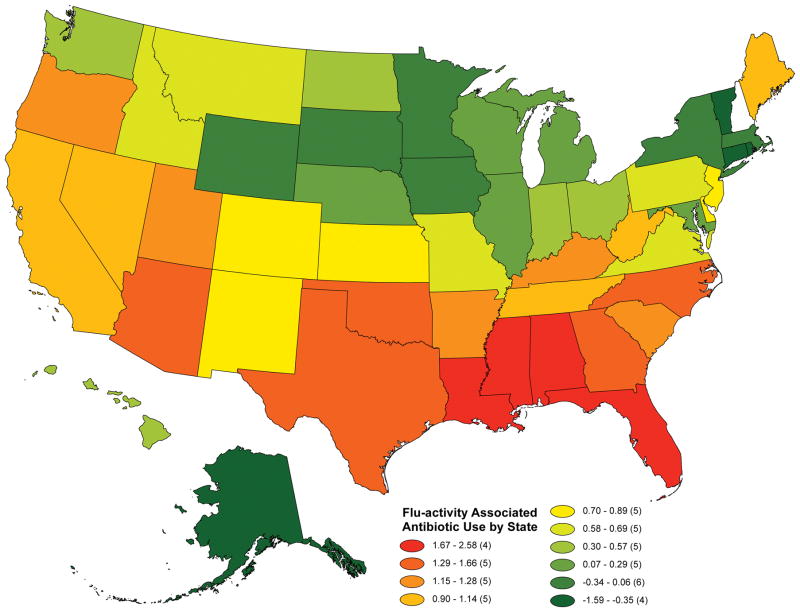
Figure 1. Geographic Variation in Adjusted Flu-Predicted Antibiotic Use per 100 Medicare Part D Beneficiaries.
Notes: Deciles of predicted, adjusted flu-associated antibiotic use per 100 Medicare beneficiaries are represented in varying colors. Predicted values are obtained following linear regression that controls for mean antibiotic use by state (using state fixed effects) and time-varying demographic characteristics including the percent of beneficiaries that are in certain age categories, percent on a low-income subsidy, percent male, percent minority and percent with chronic pulmonary disease/tobacco use. The red states are those with greater antibiotic prescribing responsiveness to flu activity and the blue states are those with less responsiveness. The value for each state is provided in Appendix Table 1.

