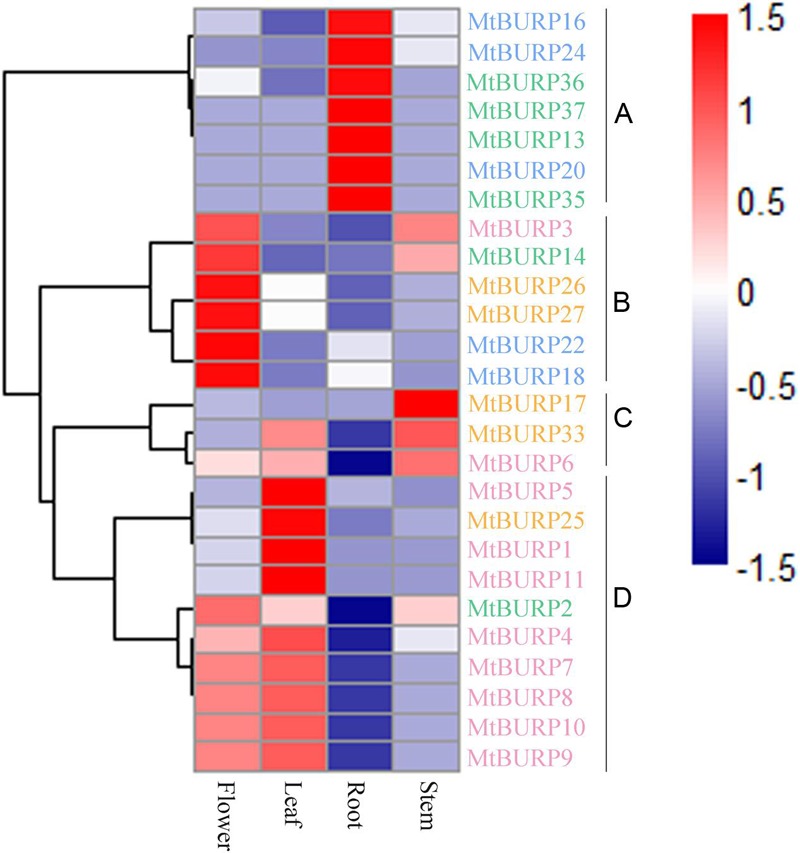
FIGURE 8.

Hierarchical clustering of MtBURP proteins in four tissues of Medicago truncatula. RNA-seq relative expression data from 4 tissues were used to reconstruct the expression patterns of Medicago genes. The raw data was normalized and retrieved from the online database (http://mtgea.noble.org/v2/). Gene names in different subfamilies are highlighted with various colors. Genes clustered into four groups (A–D) are indicated by the black vertical bars.
