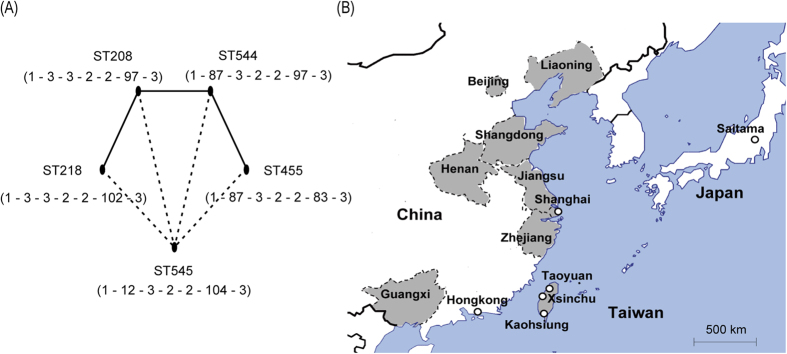
Figure 1. Genetic background and geographical information of the analyzed isolates.
Panel (A) shows the MLST results, in which the solid lines represent one-allele difference between STs, and the dotted lines represent two-allele difference. The seven numbers under ST represent the combination of alleles used by MLST-OD scheme, that is, gltA – gyrB – gdhB – recA – cpn60 – gpi – rpoD. Panel (B) shows the collection sites of the analyzed isolates.

