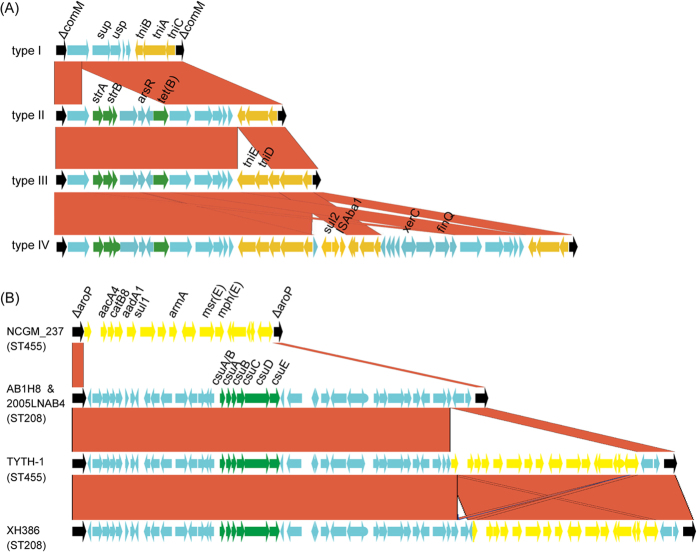
Figure 7. Structural variation of antimicrobial resistance elements.
Panel (A) shows structure variation of AbaRI. Black genes represent boundary gene comM; green genes represent resistance genes; yellow genes represent mobile elements. Red block between different AbaRI types represent conserved genes. Panel (B) shows structure variation within the gene aroP. Black genes represent boundary gene aroP; yellow genes represent class I integron, green genes represent the csu pili operon, and red blocks between strains represent conserved genes.

