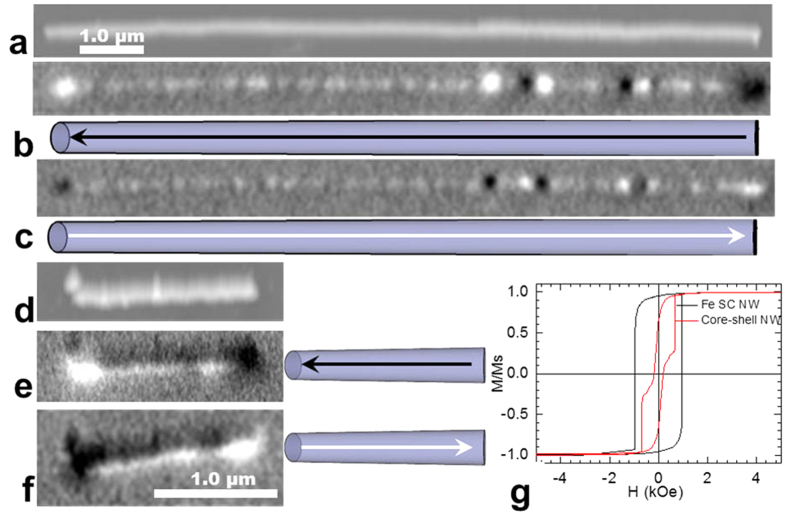
Figure 8.
Topography (a,d) magnetic force microscopy (MFM) images at remanence of (a–c) a polycrystalline Fe nanowire (NW) and (d–f) a single-crystalline Fe NW; (b,e,c,f) MFM images at remanence after saturation in the opposite direction. The drawings schematically show the direction of NW magnetization. (g) Micromagnetic simulation results of magnetic loops of single-crystalline (SC) Fe NWs before and after 1-hour annealing (core-shell NW). The saturation magnetization values of the Fe core (2.01 T) and magnetite shell (0.28 T) used in the simulations were extracted from electron holography studies.

