
Figure 1. The MRM chromatograms of nucleosides and difference of m6A contents between the two groups.
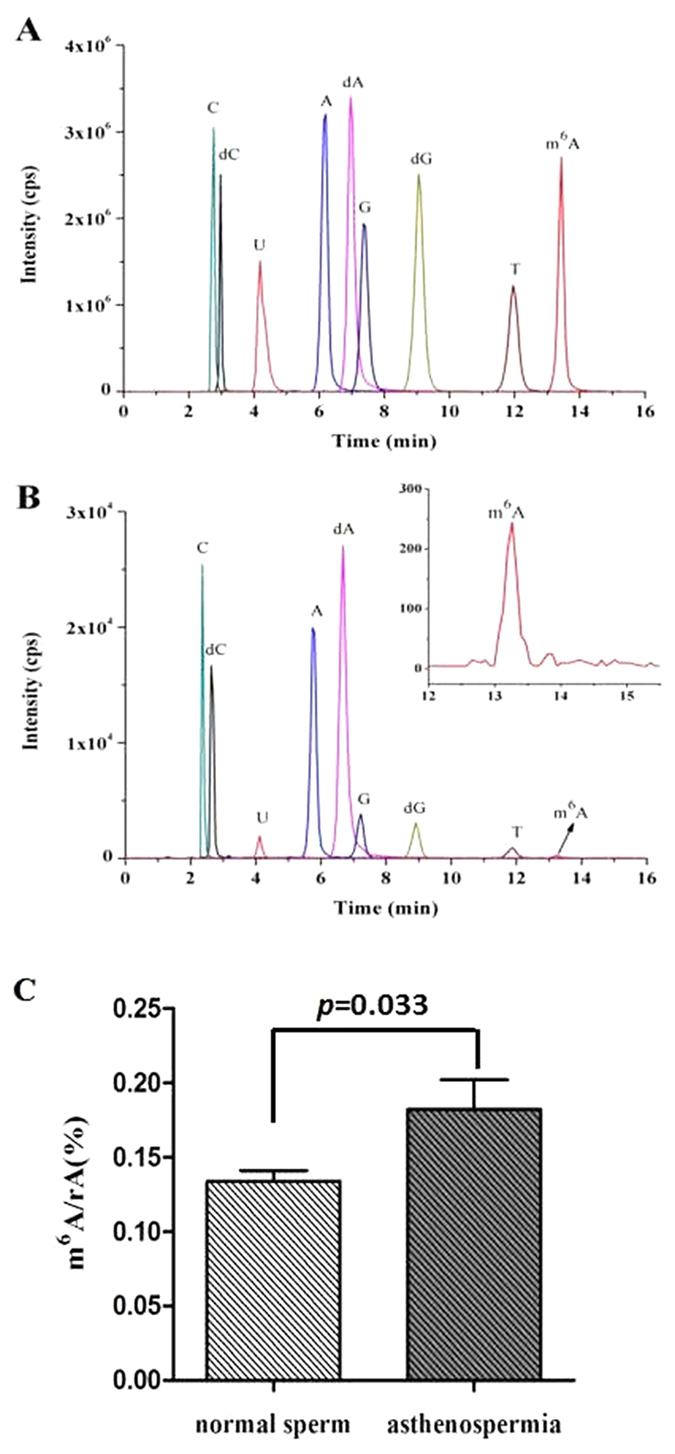
(A) Standard nucleosides. (B) 50 ng sperm RNA from an asthenozoospermia patient. Shown in inset is the enlargement chromatogram of m6A. (C) Comparative analysis of m6A contents in sperm RNA from asthenozoospermia patients (n = 20) and controls (n = 32).