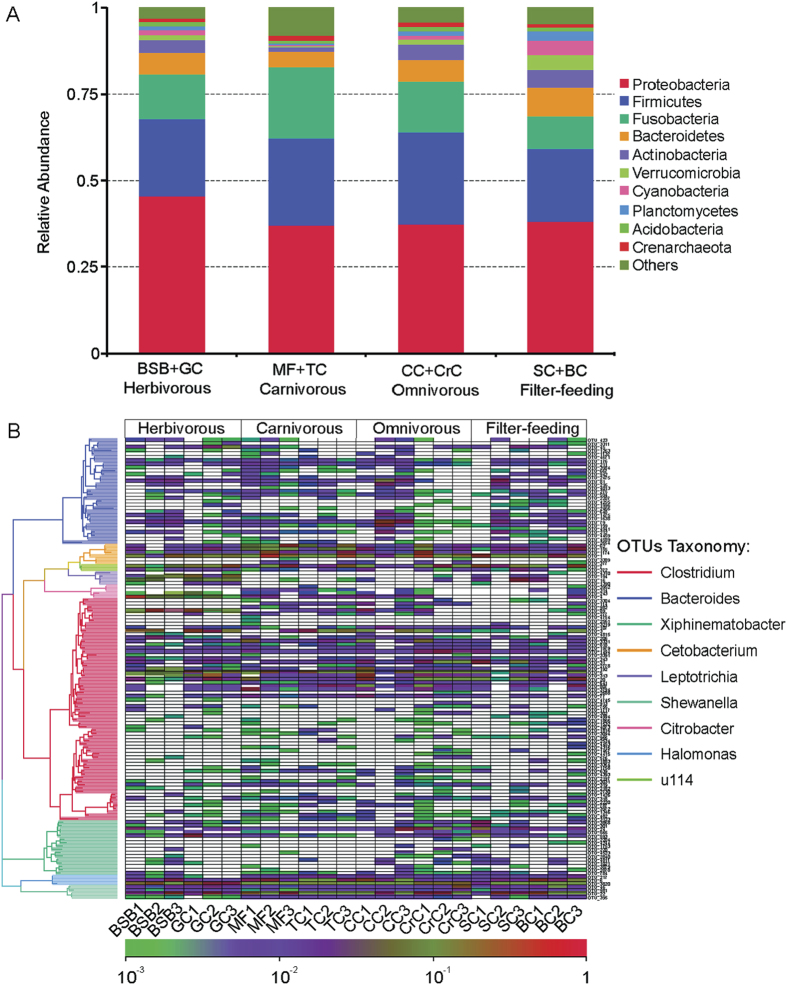
Figure 3. Composition of gut microbiota in fishes with four trophic levels at phylum and genus level.
(A) Each bar represents average relative abudance of each bacterial taxon (top 10 taxa) within a group at phylum level. (B) Heat map shows the relative percentage of each bacterial genus and the relative values for bacterial genus are depicted by color intensity with the legend indicated at the bottom of the figure.

