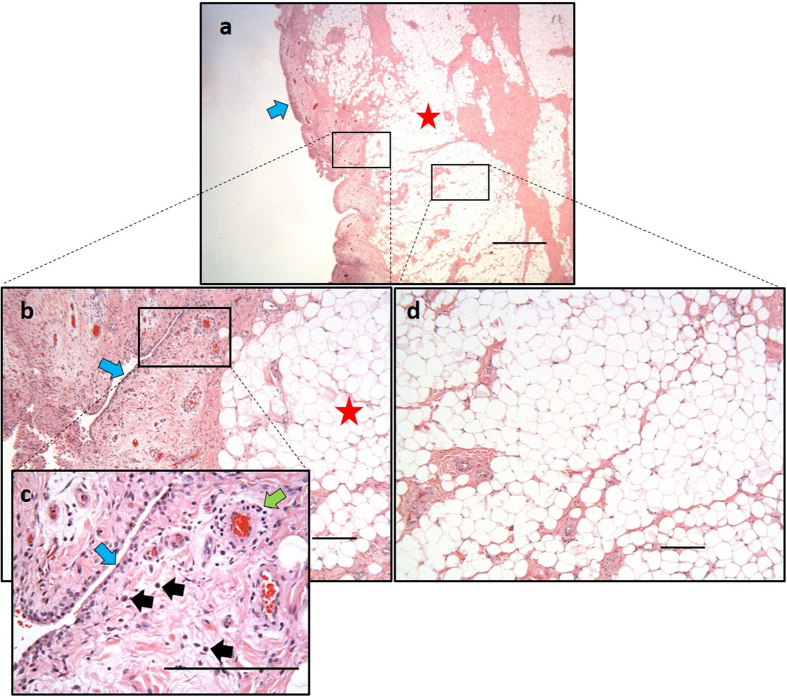
Figure 1. Example histology of a fat pad.
Samples were paraffin embedded and stained with H&E. (a) Low power view of the fat pad as received after a knee replacement showing synovium (blue arrow) and adipose tissue (red star). (b) The deep adipose tissue is indicated by a red star and the adjacent synovium is indicated by a blue arrow. (c) High magnification view of the synovium with a layer of synoviocytes (blue arrow), mast cells (black arrows), and a blood vessel surrounded by a cuff of lymphocytes (green arrow). (d) Representative region of deep-lying vascularised adipose tissue from which FP-MSCs are isolated. Scale bars represent 1 mm (a) and 200 μm (b–d).

