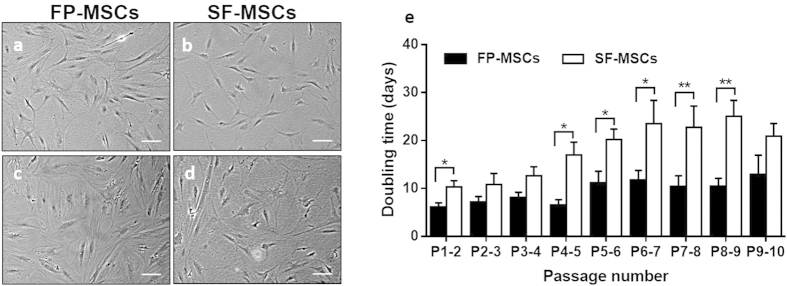
Figure 2. Microscopic photographs and growth kinetics of FP- and SF-MSCs.
(a–d) Representative images were taken at passage 2 (a,b) and passage 10 (c,d). Scale bars represent 100 μm. (e) Growth kinetics data represents the mean doubling time ± standard error of the mean (SEM) for 6 donor-matched FP and SF samples. Over 10 passages, SF-MSCs show a significantly longer doubling time compared to FP-MSCs (P = 0.018). *P < 0.05, **P < 0.01.

