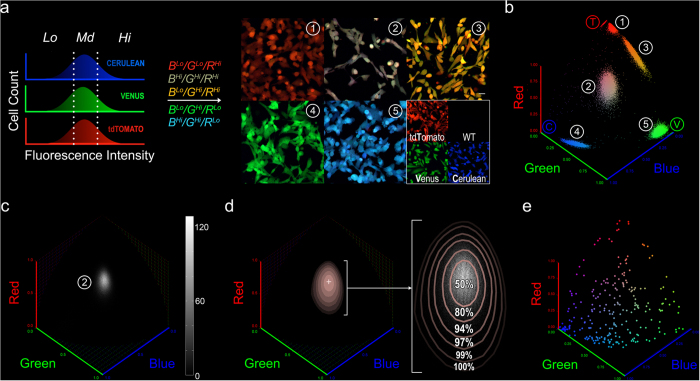
Figure 2. Clonal founder cell selection, clonal chromatic mode and chromatic spread.
(a) Combinatorial gating scheme for single clonal founder cell sorting. RGB channels were gated by intensity and different combinations of these R/G/B channel gates were used to select single cells from MelaChromas for clonal expansion. MelaChromas of various MOIs (0.7, 2.8, 4.9) were used the source of founder cells. As a result, a wide variety of FP expression levels and Cerulean(B):Venus(G):tdTomato(R) ratios were represented in the selected cells, as shown in the confocal images of expanded clones. For visual reference, confocal images of 1FP-expressing clones and un-transduced A375 cells (A375-WT) at 50% magnification are also shown. Scale bar: 25 μm. (b) Spherical scatter plots of the clones in (a). 1E4 cells were analyzed by flow cytometry per clone. (c) Spherical histogram of clone #2 in (a,b). (d) Chromatic mode (crosshair) and chromatic spreads (pink) of clone #2. Chromatic spreads, as projections of isosurfaces drawn at 50%, 25%, 10%, 5%, 2%, and 1% of the highest cell count at the chromatic mode (Supplementary Fig. S4), co-localized with the high cell count region in the clonal spherical histogram (same as (c), shown magnified in white). Values indicate the actual percentage of clonal cells with chromaticity values enclosed within each contour. (e), Spherical scatter plot showing the chromatic mode coordinates of the 256 expanded MelaChroma clones.

