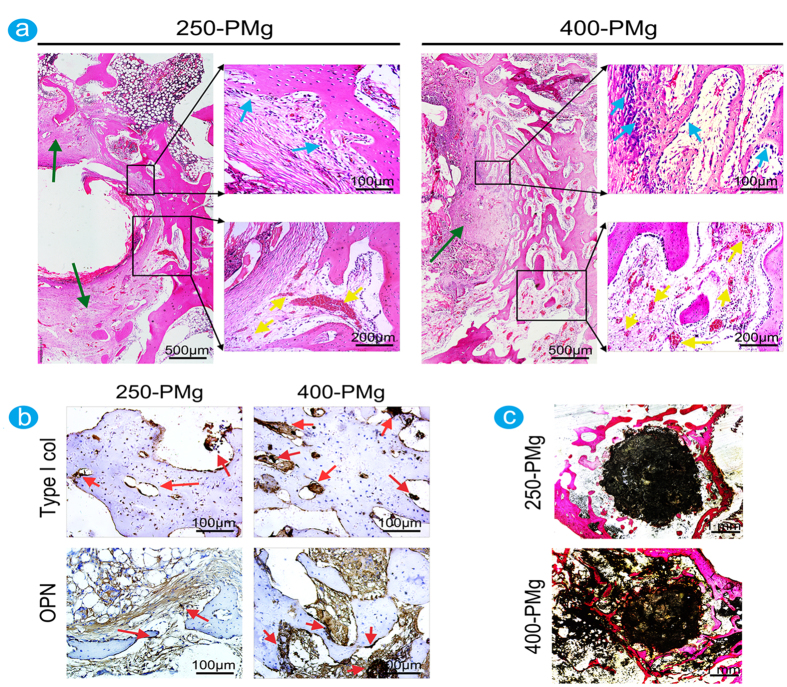
Figure 7. Histological and immunohistological analysis of bone formation at 8 weeks after the implantation.
(a) Representative histological analysis (H&E staining) of bone formation in the 250-PMg and 400-PMg scaffold group. The lower images are higher magnifications of the areas within the black boxes. In the 250-PMg scaffold group, a fibrotic walling-off phenomenon based on the formation of regular dense fibrous tissues (green arrows) with rare inflammatory cells was observed, whereas less fibrous tissue accompanied with more lymphocytes, macrophages and foreign body giant cells (FBGCs)were present around the 400-PMg scaffold. Compared with the 250-PMg scaffold, more new bone formed around 400-PMg scaffold, and more abundant cuboid osteoblasts (blue arrows) were observed between the fibrous tissue and new bone. Furthermore, in the 400-PMg scaffold group, more newly blood vessels (yellow arrows) formed than in the 250-PMg scaffold group. (b) Relatively higher expressions of collagen type 1 and OPN (red arrows) in the 400-PMg scaffold group than that in the 250-PMg scaffold group. (c) Representative histological analysis (Van Gieson’s picrofuchsin staining) of bone formation in the 250-PMg and 400-PMg scaffold group. Significantly more new bone formed in the 400-PMg scaffold group was observed.

