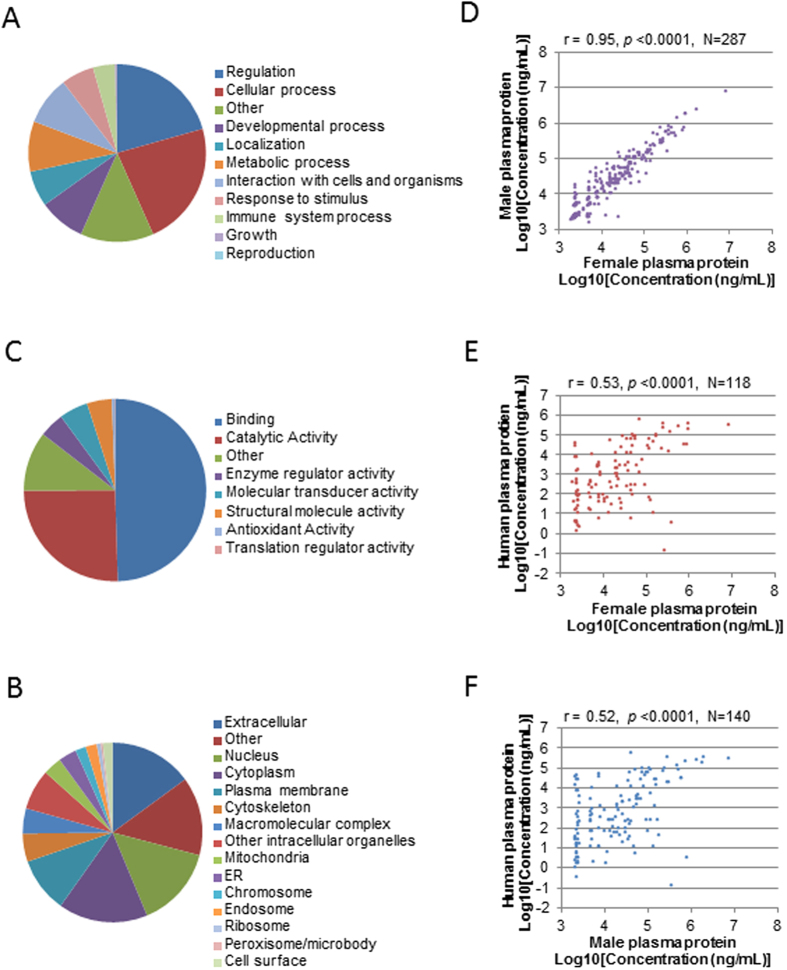
Figure 5. Comparison of zebrafish and human plasma proteomes based on Plasma Proteme Database (PPD).
(A–C) GO distribution of human plasma proteins in the categories of Biological Process (A), Cellular Component (B), and Molecular Function (C). Both the ranks of terms and the corresponding percentages are similar to those in zebrafish plasma (Fig. 2A–C). (D) Pearson correlation between zebrafish female and male plasma proteins based on concentration of overlapping proteins. (E,F) Pearson correlation between human plasma proteins and zebrafish female (E) and male (F) plasma proteins, based on corresponding concentrations of homologous proteins.

