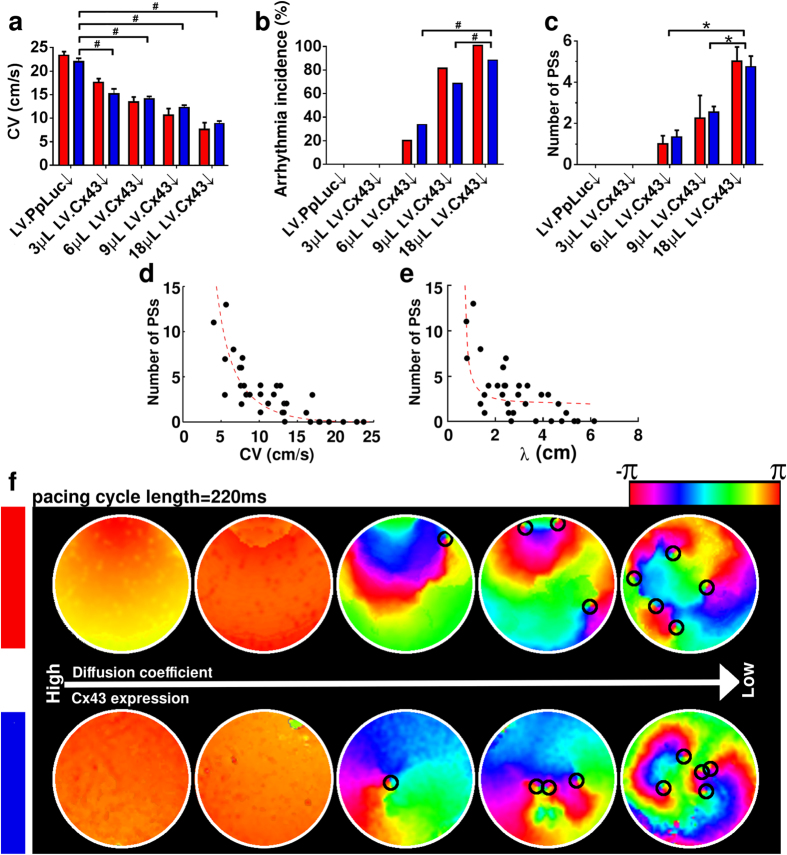
Figure 1. Complexity of electrical activation patterns increases with decreasing CV.
Comparison of (a) CV, (b) arrhythmia incidence and (c) arrhythmia complexity (i.e., number of PSs) in NRVM monolayers in silico (red bars) and in vitro (blue bars) at different levels of intercellular coupling and in the presence of 30% interspersed MFBs (N > 9). Statistical analysis was performed by comparing LV.PpLuc↓-transduced cell cultures (negative control) with cell cultures exposed to different amounts of LV.Cx43↓. Statistical significance was expressed as follows: *P < 0.05, #P < 0.001. Relationship between arrhythmia complexity and (d) CV or (e) wavelength (λ), defined as: APD80 × CV. (f) Pseudocolor plots of phase maps from the in silico (top panel) and in vitro (bottom panel) datasets. The small black circles indicate the locations of PSs.

