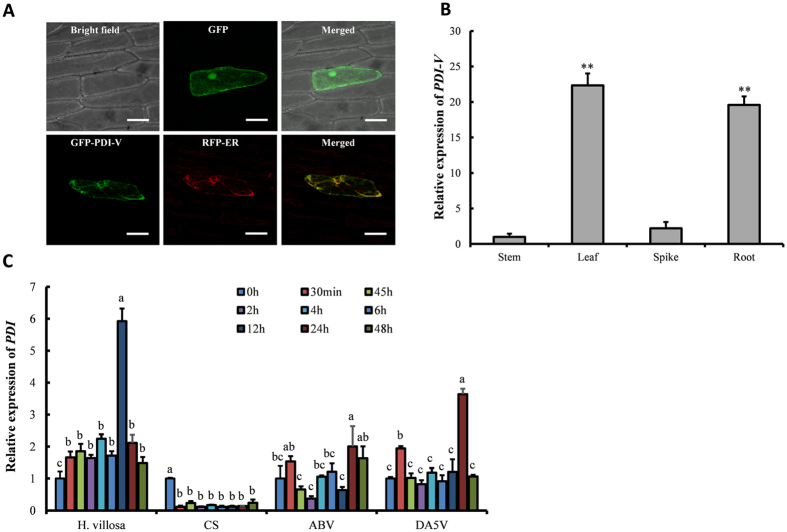
Figure 3. Subcellular localization of PDI-V and expression profiling of PDI-V.
(A) Subcellular localization of GFP-PDI-V co-expressed with RFP in onion epidermal cells. Localization of green fluorescence protein (GFP) as control is shown in the upper panel. The first image in the lower panel shows the green GFP-PDI-V signal localized in the endoplasmic reticulum and the second image shows localization of the RFP ER marker. The third image in this panel shows the co-localization of GFP-PDI-V and RFP-ER. Scale bar = 100 μm. (B) Expression pattern of PDI-V in tissues (stem, leaf, immature spike and root) of H. villosa (C) Expression pattern of PDI in H. villosa and wheat lines i.e. Chinese Spring (CS), T. turgidum-H. villosa amphiploid (AABBVV), and the 5V addition line (DA5V) after inoculation with Bgt. Each result is the mean of three independent biological repeats while bars show standard deviations. The Tubulin gene was used as an internal control to normalize qRT-PCR values. The lower script alphabet letters represent the statistically significant differences at p = 0.05 (one way ANOVA test).

