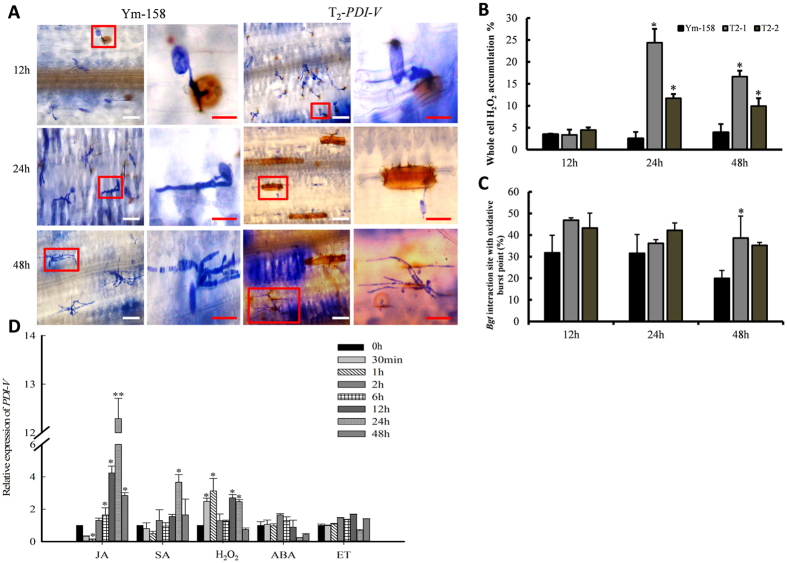
Figure 7. Accumulation of H2O2 at the Bgt infection sites in wheat epidermal cells.
(A) Microscopic view of H2O2 production in wheat leaf epidermal cells. Two-week-old seedlings were inoculated with Bgt and sampled at different time points as indicated. H2O2 accumulation was detected by in situ histochemical staining using DAB and observed in bright field under an Olympus microscope. Enlarged views of marked red boxes in lanes 1 and 3 (scale bar = 30 μm) are shown in lanes 2 and 4. Scale bar = 20 μm. (B,C) Percentage of cells with H2O2 accumulation throughout the entire cell, and with accumulation only around the infection sites in Yangmai 158 and PDI-V-over-expressing plants. (D) Expression pattern of PDI-V in response to exogenous hormones. Each result is the mean of three independent biological repeats; bars show standard deviations. The Tubulin gene was used as an internal control to normalize qRT-PCR values. Asterisks indicate a significant difference (P < 0.05) from the control (0 hpi) based on Student’s t-tests. JA, methyl jasmonate; SA, salicylic acid; H2O2, hydrogen peroxide; ET, ethylene.

