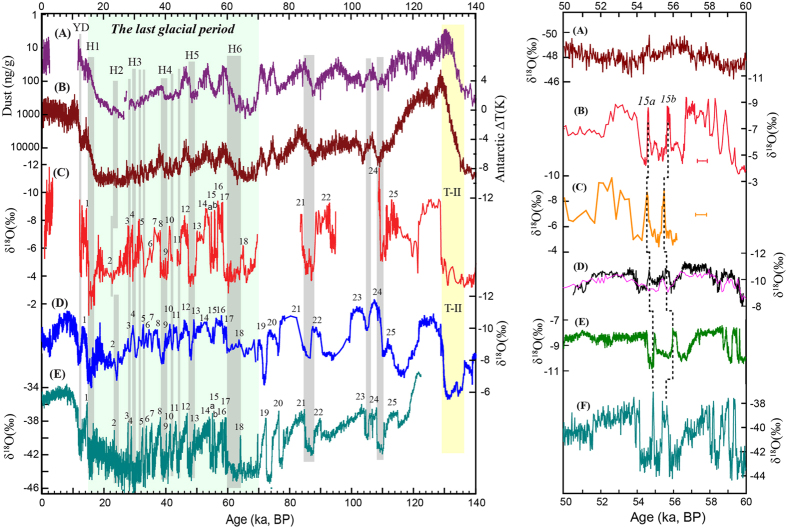
Figure 2. Comparison of climate events in ISM and EAM records over the last 140 ka.
Left panel: (A) and (B) are dust41 and temperature30 records from Antarctic ice-core EDC, respectively. (C) Northern India δ18O record. (D) EAM δ18O record25. (E) Greenland NGRIP ice-core δ18O record22. Vertical grey bars indicate weak ISM events and their correlations to weak EAM events, cold events in Greenland, and higher temperature and less dust loading in Antarctica. The yellow bar shows glacial termination T-II. Numbers depict the Indian (C), Chinese (D) and Greenland (E) Interstadials, respectively. These millennial-scale variations are synchronous within age uncertainties. Light-green shading marks the last glacial period. The synchronicities of MIS 3 and MIS 5e between the ISM and EAM demonstrate the in-phase variability of the two monsoon systems on the orbital timescale. Right panel: (A) Antarctic ice core EDML δ18O record42. The δ18O scale is reversed as compared with speleothem records. (B,C) ISM records from Bittoo cave stalagmites BT-2 (red) and BT-1 (orange). Error bars depict typical 230Th dating errors (2σ). (D) EAM record from Chinese speleothem records (Wulu record in black31 and Hulu record in purple25). (E) The central Europe temperature variation inferred from speleothem records32. (F) Greenland NGRIP δ18O ice-core record22. The striking similarity/difference of the ISM variability with/from Greenland/Antarctic records implies a dominant NH rather than SH control on ISM dynamics.

