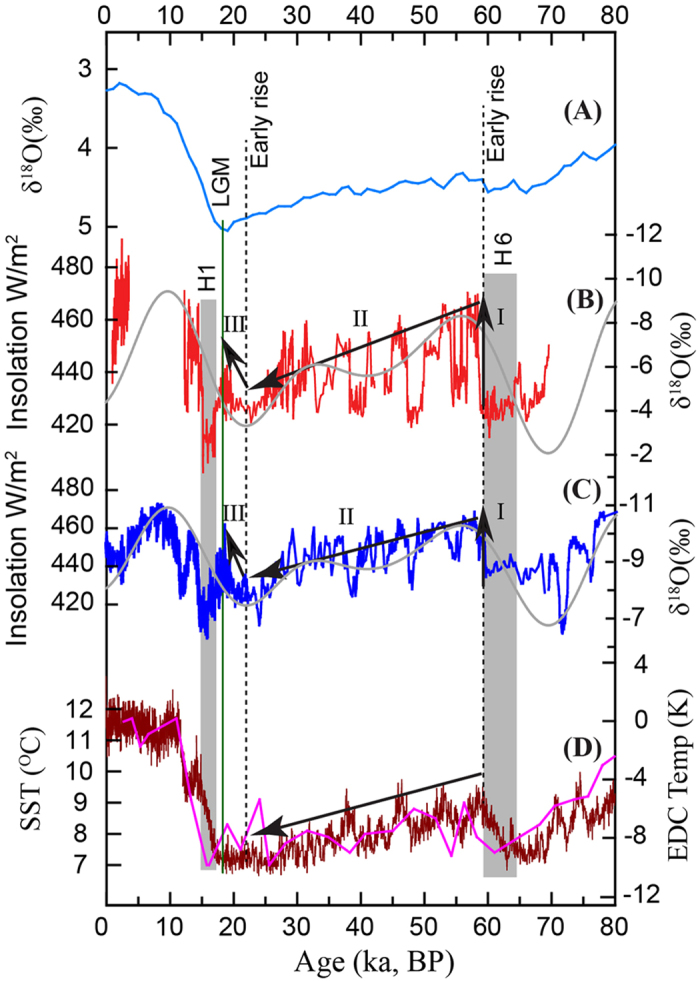
Figure 3. Early ISM increases prior to the LGM during the last glacial period.

(A) Benthic stack δ18O record43. (B) North India record (red) and July 21 insolation 65°N40 (grey curve). (C) EAM record25 (blue) and July 21 insolation 65°N40 (grey curve). (D) Antarctic temperature record from ice core EDC30 (brown) and southern Indian Ocean SST29 (purple). The vertical grey bars depict Heinrich events 1 and 6. Arrow-I marks the abrupt shift of both ISM and EAM at ~60 ka BP when Antarctic temperature reached a maximum about 40 ka prior to the LGM. Arrow-II depicts the ISM and EAM decline concurrently with temperature decreases of both Antarctica and southern Indian Ocean (arrow in D) rather than their temperature increases. Arrow-III indicates another early ISM and EAM rise at ~22 ka BP, about 2.5 ka prior to the LGM and about 3 ka after Antarctic temperature reached the minimum at ~25 ka BP. Both early monsoon rises appear to have coincided with NHSI rise rather than with an Antarctic temperature cooling (D), thus providing an alternative explanation.
