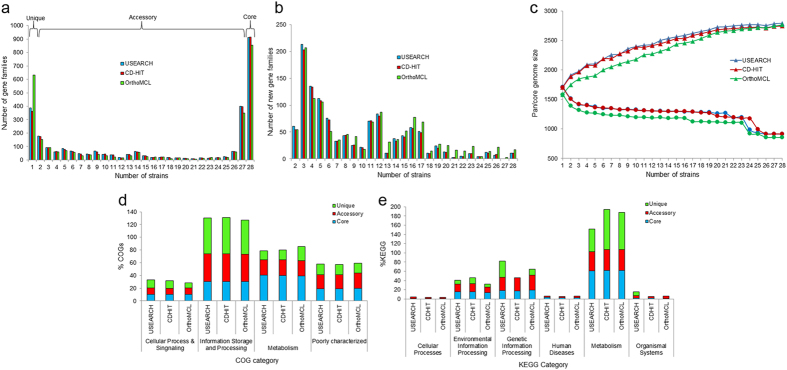
Figure 2. Overview of the results generated by BPGA using 28 strains of S. pyogenes.
(a) The gene family frequency spectrum. (b) New gene family distribution after sequential addition of each genome to the analysis. (c) The pan genome profile trends obtained using clustering tools- USEARCH, CD-HIT and OrthoMCL. (d) COG distribution of core, accessory and unique genes. (e) KEGG distribution of core, accessory and unique genes.

