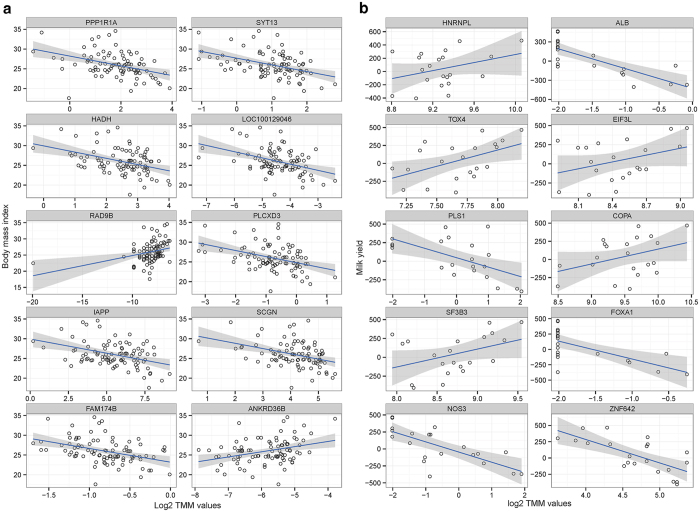
Figure 1. Ten of the most significantly associated genes from the simple linear regression with two types of RNA-seq data, respectively.
The X-axis represents log2 TMM normalized gene expressions. Y-axis represents quantitative traits such as BMI and breeding value of the milk yield for human and bovine RNA-seq data, respectively. The blue-lines and grey-area represent estimated fit-line and standard errors estimated from the ordinary lease squared estimator, respectively. (a) Significantly detected BMI-associated genes in human RNA-seq data analysis (FDR adjusted P-value < 0.1). RAD9B gene shows that the result is strongly affected by outlier points. (b) Significantly detected milk yield-associated genes in bovine RNA-seq analysis. In the result of bovine analysis, relatively higher standard errors were estimated than human analysis, which may be due to the sample size difference.

