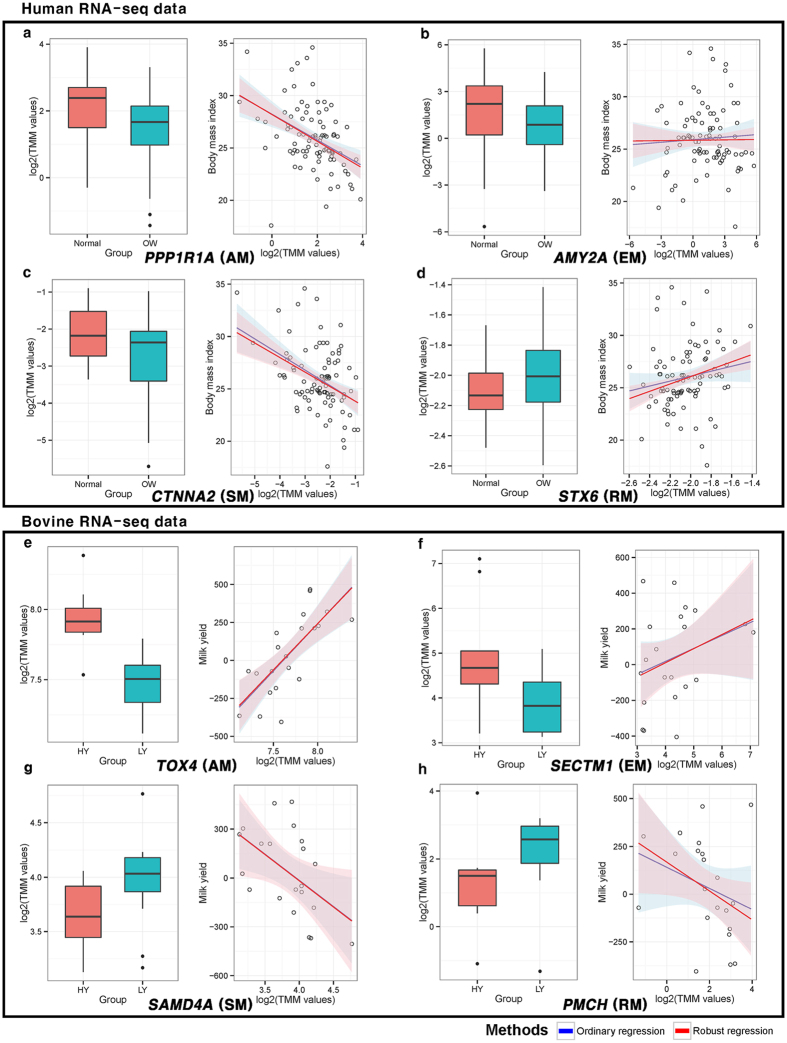
Figure 3. Representative patterns of gene expressions in four categories.
Significantly detected genes were distinguished as four categories: ‘significant in all methods’ (AM), ‘only significant in existing methods’ (EM), ‘only significant in suggesting methods (SM), and ‘only significant in robust method’ (RM). The fitted line-plots are composed between TMM normalized values on x-axis and each trait on the y-axis. The blue and red lines represent fitted line of the ordinary and robust regression, respectively. The box-plots consist of forced conversion group such as normal vs. over weight (OW) for human data and high yield (HY) vs. low yield (LY) groups on x-axis and TMM normalized values on y-axis. In the result of human RNA-seq analysis, we selected four representative genes on their included category. (a) PPP1R1A gene that is significant from both linear based approaches and existing methods (DESeq2 based two group comparison). (b) AMY2A gene significant from two group comparison only. (c) CTNNA2 gene from only the association test based approaches (d) STX6 gene from robust regression method only. From the result of bovine RNA-seq analysis, four representative genes were selected such as (e) TOX4 gene, significant in the all approaches. (f) SECTM1, only significant in the two group comparison. (g) SAMD4A, only significant in the association test based approaches. (f) PMCH, only significant in the robust regression.

