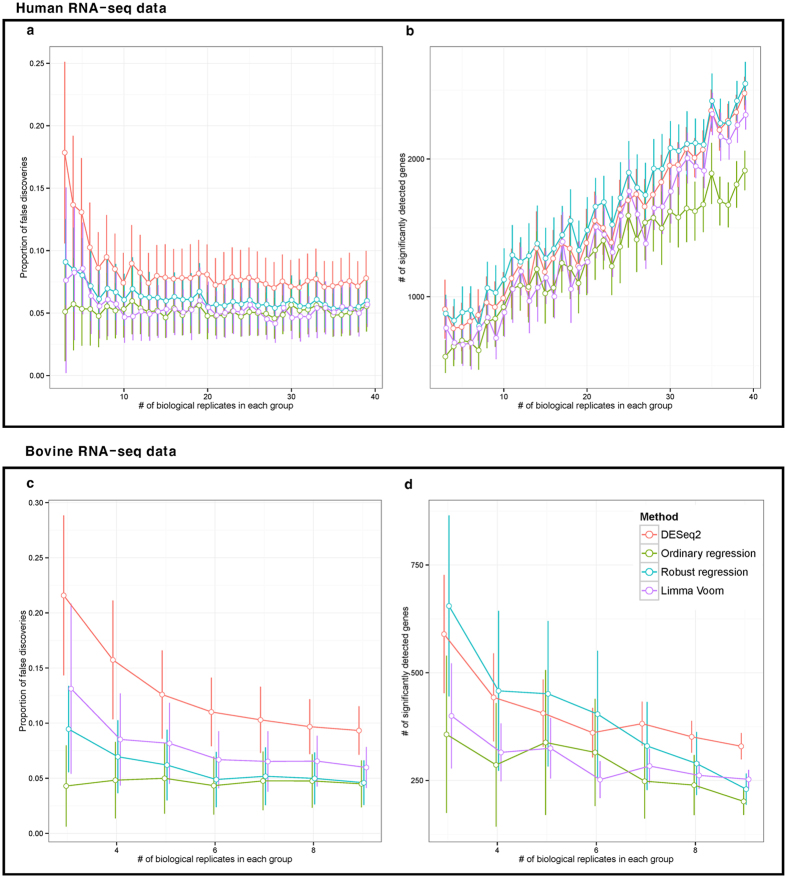
Figure 4. Calculation of the proportion of false discoveries using mock comparison.
The result of proportion of false discoveries using mock comparison. As minimum number of replicates required for least square estimator (LSE) is 3 samples, 3 to 37 replicates in Human RNA-seq data and 3 to 9 replicates in bovine RNA-seq data in each group, were employed for mock comparison. The x-axis is number of biological replicate in each group and y-axis is proportion of false discoveries or number of significantly detected gene in each methods, (a,c) and (b,d), respectively, with 5% significance level. We observed suggesting approaches have smaller portion of false discoveries than existing methods especially in DESeq2.

