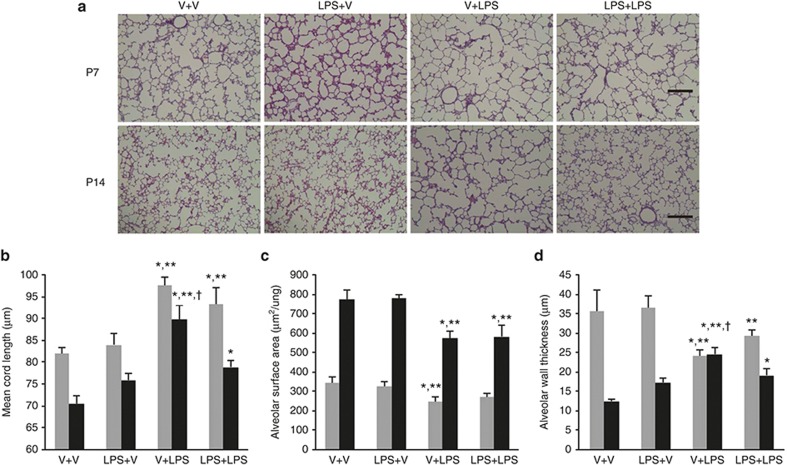
Figure 4.
Alveolar development and morphometric data. (a) Representative light microscopic images of the rat lungs on P7 and P14. Apparently thinned septal walls were observed in the V+LPS group compared with other groups on P7, and markedly large and simple airspaces were observed in the V+LPS group compared with other groups on P14. Hematoxylin and eosin stained; original magnification ×100. Bars, 200 μm. (b–d) Gray bars denote P7 and black bars P14. (b) The mean cord length (Lm), indicating the average alveolar size, was greater in the i.p. LPS-treated groups than in the i.p. vehicle-treated groups on P7. The Lm was decreased on P14 as the lungs developed in all groups, but V+LPS group had the highest Lm among the groups. (c) The alveolar surface area (SA) was smaller in the V+LPS group than in the i.p. vehicle-treated groups on P7. The SA increased on P14 as the lungs developed in all groups, but the i.p. LPS-treated groups had a smaller SA than the i.p. vehicle-treated groups. (d) The alveolar wall thickness (WT) was thinner in the i.p. LPS-treated groups than in the V+V group on P7. The WT was thinned on P14 as the lungs developed in all groups except the V+LPS group, and the V+LPS group had the thickest WT on P14. Group abbreviation: V+V, i.a. vehicle followed by i.p. vehicle-treated group; LPS+V, i.a. LPS followed by i.p. vehicle-treated group; V+LPS, i.a. vehicle followed by i.p. LPS-treated group; LPS+LPS, i.a. LPS followed by i.p. LPS-treated group. The data are the mean ± SEM (N = 6–7 in each group). *P <0.05 vs. V+V, **P < 0.05 vs. LPS+V, †P < 0.05 vs. LPS+LPS. V, vehicle.

