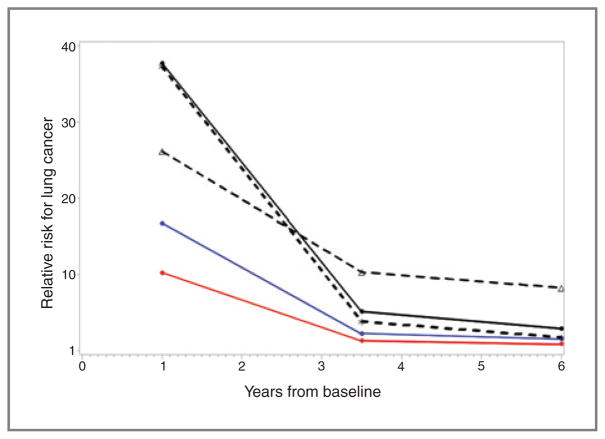
Figure 1.
Relative risks are plotted at the midpoints of the three time periods. There are three curves (solid black, red, and blue lines) for the overall RR for any NCN versus no NCN at the person (red), lung (blue), and lobe (black) levels. There are two additional curves (black dotted lines), for the RR of either soft tissue or ground glass (GG) nodules compared with no NCN, at the lobe level (asterisk, soft tissue; triangle, GG).

