
Figure 1.
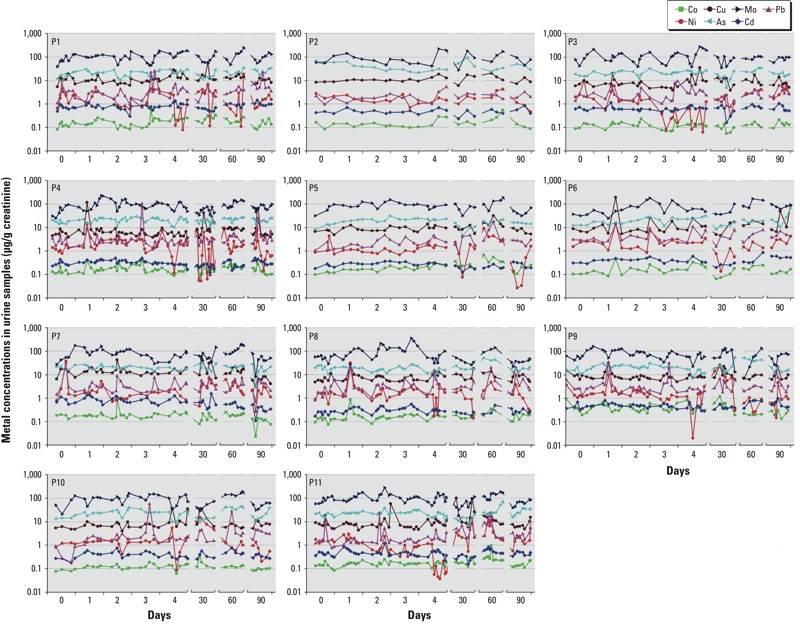
Creatinine-corrected metal concentrations (μg/g creatinine) in the urine collected from 11 men on 8 days during a 3-month period. Each graph represents an individual participant (labeled P1–P11). The dots in each graph represent the metal concentrations in each spot urine sample (including first morning samples) collected on each sampling day.