
Figure 4.
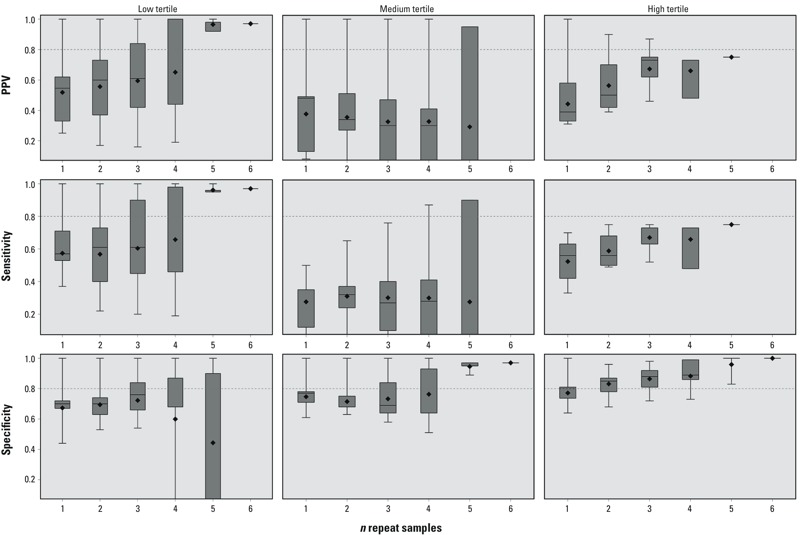
Surrogate category analysis among males, analysis 2, for PPV, sensitivity, and specificity. The displayed values are the minimum (bottom whisker), 25th percentile (bottom of box), median (line in box), mean (diamond), 75th percentile (top of box), and maximum (top whisker). The horizontal line at 0.8 is a reference line. The x-axis represents the number of repeated samples. Tertiles were defined as follows: low (< 2.20 ng/mL), medium (≥ 2.20 ng/mL to < 4.15 ng/mL), high (≥ 4.15 ng/mL). For corresponding numeric data, see Supplemental Material, Table S4.