
Fig. 3.
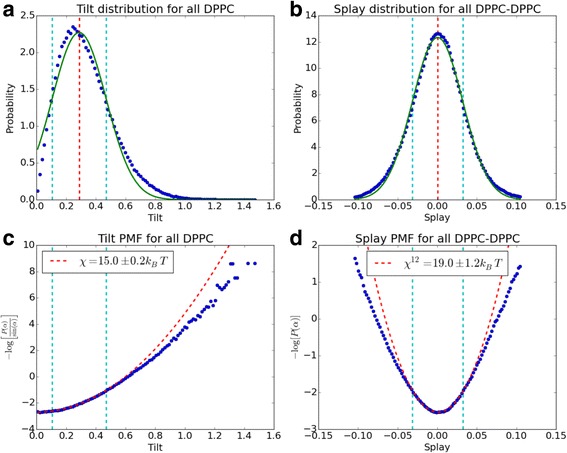
Tilt and splay distributions and fits. Example of the plots automatically generated by the ExtractTiltAndSplayModuli function for the case of a simple DPPC planar bilayer. (a) The distribution of tilts P (θ) with the fitted gaussian G(μ, σ) in green. The mean of the distribution μ is shown as a red dashed line while the fitting interval [μ − σ, μ + σ] is shown as blue dashed lines. (b) Same as (a) but for lipid splays. (c) The PMF for lipid tilts with the corresponding quadratic fit (eq. 2) shown as a dashed red line. (d) The PMF for lipid splays with the corresponding fit (eq. 5) shown as dashed red line. Extracted elastic constants are shown in the legends