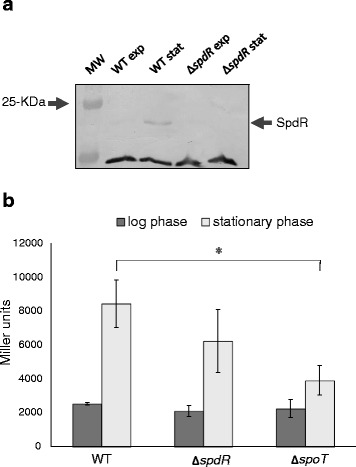
Fig. 1.

Analysis of SpdR and SpdS expression at stationary phase. a Total proteins from NA1000 and spdR mutant strains were extracted in exponential phase (exp) and stationary phase (stat) in PYE medium and separated by a 12 % SDS-PAGE. Following protein transfer to a nitrocellulose filter, an immunoblot assay was carried out with anti-SpdR anti-serum (1:500), identifying the 21-kDa band corresponding to SpdR. The 25-kDa band of the prestained Molecular Weight marker (MW) is indicated. A non-specific band recognized by the antiserum is shown to allow assessment of the protein concentration in each lane. b The expression driven by the spdS promoter cloned upstream of the lacZ reporter gene was assessed by β-galactosidase activity assays, both in logarithmic and stationary phases. The reporter plasmid was introduced into the C. crescentus strains NA1000, MM85 (ΔspdR) and SP0200 (ΔspoT). Results are the means of three experiments, and bars indicate the respective standard errors. Asterisk indicates a statistical difference between the parental strain and ∆spoT strain at stationary phase (p < 0.01) as determined by Students’ T-test
