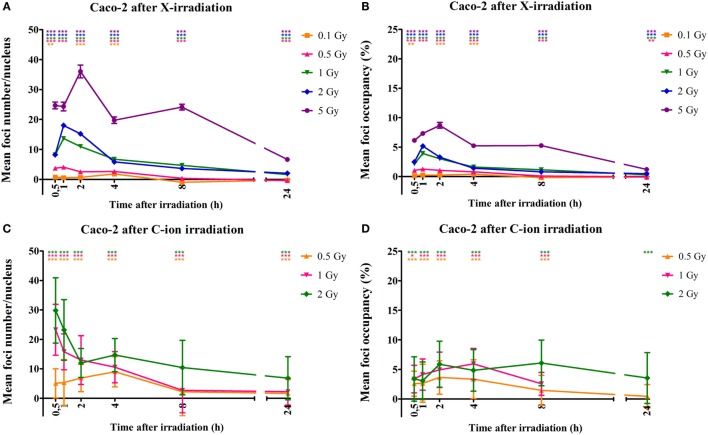
Figure 4.
Quantification of γ-H2AX foci number and occupancy in X- and carbon ion-irradiated Caco-2 cells. Dots representing mean γ-H2AX foci number per nucleus vs. time (A) and mean foci occupancy per nucleus vs. time (B) after X-irradiation in Caco-2 cells. Dots representing mean γ-H2AX foci number per nucleus vs. time (C) and mean foci occupancy per nucleus vs. time (D) after exposure to carbon ions. Fiji software was used to count the number of nuclei and foci occupancy in each nucleus. For X-rays, the error bars represent the SEM of three independent experiments; for carbon ion data, the error bars represent STDEV of the experiment. Statistical Kruskal–Wallis analysis with Dunn’s multiple comparison tests were performed in GraphPad with **p < 0.01 (vs. control cells), ***p < 0.001 (vs. control cells).

