
Fig. 4.
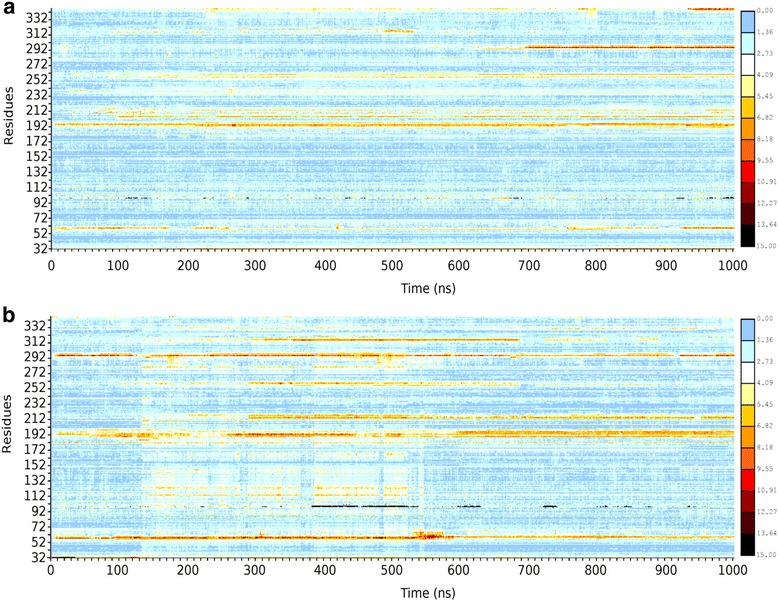
a RMSD per residue heat-map (scale 0–15, from low/blue to high/red) for WT Gαo throughout a 1 μ-second MD simulation. b RMSD per residue heat-map for mutant Leu199Pro Gαo. RMSD comparisons made against respective initial structures
Official websites use .gov
A
.gov website belongs to an official
government organization in the United States.
Secure .gov websites use HTTPS
A lock (
) or https:// means you've safely
connected to the .gov website. Share sensitive
information only on official, secure websites.
a RMSD per residue heat-map (scale 0–15, from low/blue to high/red) for WT Gαo throughout a 1 μ-second MD simulation. b RMSD per residue heat-map for mutant Leu199Pro Gαo. RMSD comparisons made against respective initial structures