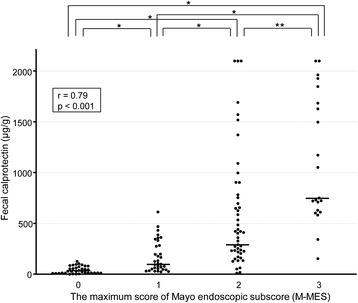
Fig. 1.

Scatterplot showing correlation of fecal calprotectin (FC) level with maximum of Mayo endoscopic subscore (M-MES). The median and interquartile range (IQR) for FC levels in patients with an M-MES of 0 (n = 35), 1 (n = 33), 2 (n = 47), and 3 (n = 21) were 35.2 (17.3-76.6), 103.3 (55.2-336.4), 295.0 (162.9-1000.0), and 751.9 (632.8-1685.6) μg/g, respectively. *p < 0.001, **p < 0.01
