Fig. 1.

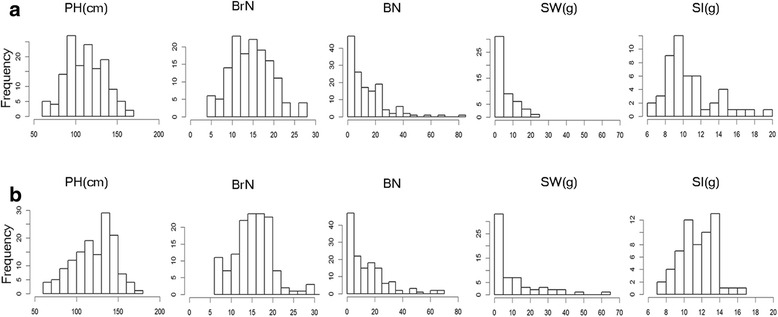
Distribution of plant traits in the two evaluated F2 populations. a: (3E) F2, b: (E3) F2. PH, BrN, BN, SW and SI are abbreviated for plant height, branch number, boll number, seed set weight (g), seed index (g), respectively

Distribution of plant traits in the two evaluated F2 populations. a: (3E) F2, b: (E3) F2. PH, BrN, BN, SW and SI are abbreviated for plant height, branch number, boll number, seed set weight (g), seed index (g), respectively