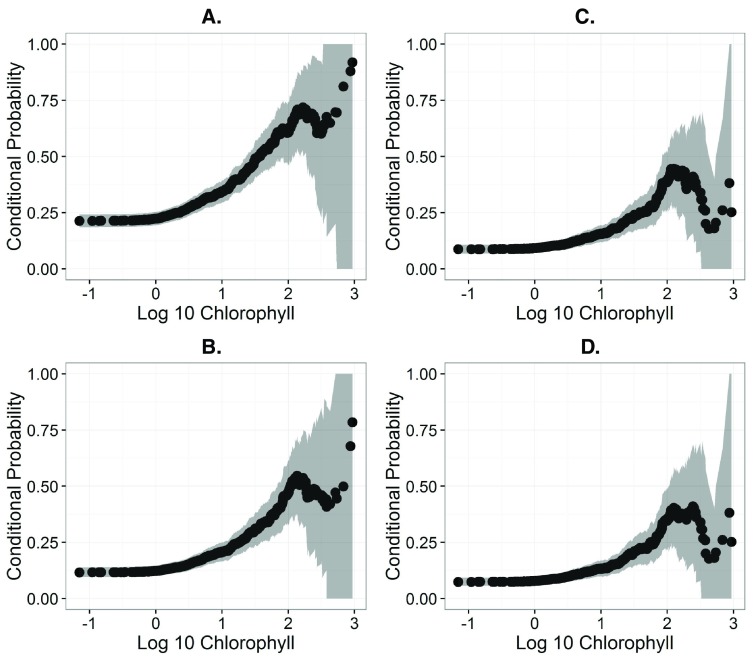
Figure 1. Conditional probability plots showing association between the probability of exceeding various microcystin-LR (MLR) health advisory Levels.
A.) Plot for USEPA Child (0.3 µ g/L). B.) Plot for WHO Drinking (1 µ g/L). C.) Plot for USEPA Adult (1.6 µ g/L). D.) Plot for WHO Recreational (2 µ g/L).

