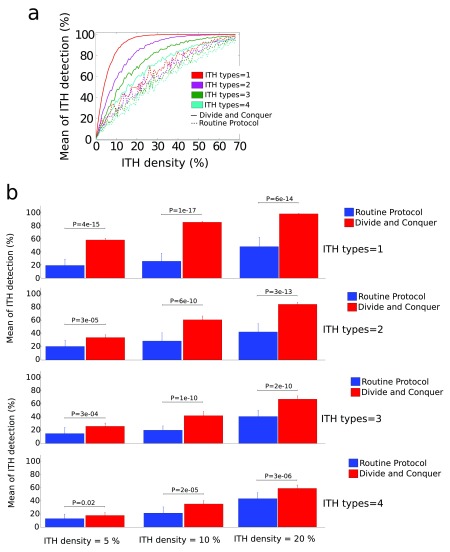
Figure 3. Results from the computational modeling for C = 4 ITH types and the situation of regional ITH.
Similar to Figure 2 for C = 1, DAC performed equally as RP for random ITH (not visualised). a: regional ITH, DAC plotted as solid lines, RP as dashed ones. Different colors correspond to different ITH types. The mean of ITH detection (measured in %) is represented as function of the ITH density (also in %). Notice that, for the simulations we have performed here, DAC performed better in detecting all the C = 4 ITH types in comparison to the performance that RP achieved when only 1 ITH type existed. b: P-values after t-test (as implemented in Matlab, function ttest) showing significant differences in performance between DAC (blue) and RP (red) for different values of ITH density.

