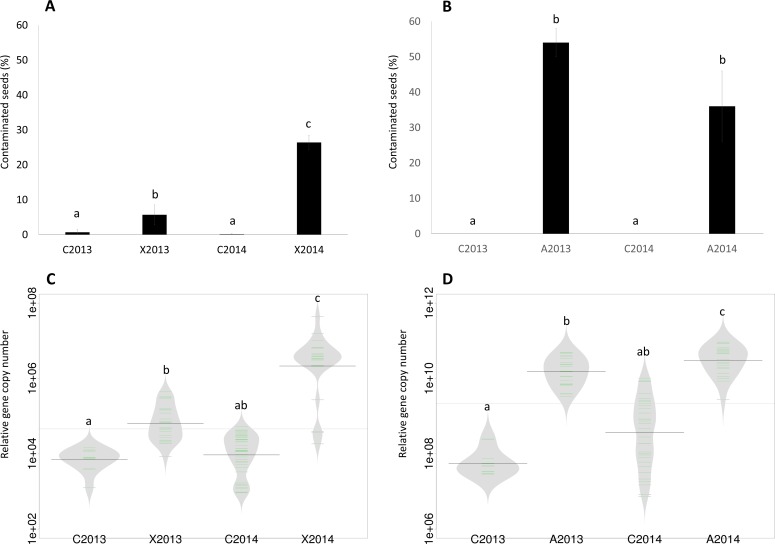
Figure 1. Assessment of seed contamination by X. campestris pv. campestris 8004 and A. brassicicola Abra43.
The contamination rate of seed samples by X. campestris pv. campestris 8004 (A) and A. brassicicola Abra43 (B) was assessed through microbiological analysis of 96 and 100 individual seeds, respectively. Contamination rates are the mean of 6 independent biological replicates performed for each experimental year. Quantitative detection of Xcc (C) was performed on seed samples harvested from uninoculated plants (C2013 and C2014) and plants inoculated with Xcc (X2013 and X2014) through qPCR with primers targeting XC_1533. Quantitative detection of Ab (D) was performed on seed samples harvested from uninoculated plants (C2013 and C2014) and plants inoculated with Ab (A2013 and A2014) through qPCR with primers and probe targeting AbDhn1. The green lines represent the number of each target gene in the different samples, while bold dark black lines represent the median. The grey area indicates the density of distribution. Differences in contamination rate and relative abundance were considered significant at a p-value ≤0.01 (as assessed by 2-sample test for equality of proportions and ANOVA with post hoc Tukey’s HSD test, respectively).

