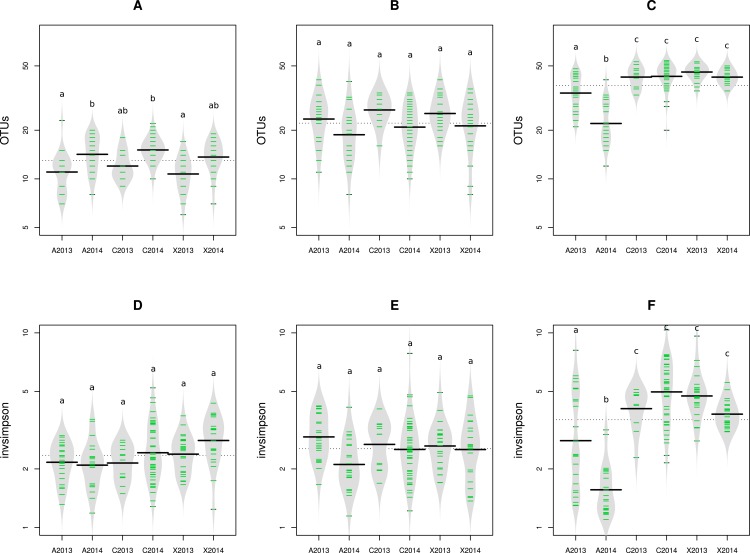
Figure 2. Richness and diversity of seed samples observed with abundant OTUs.
Microbial richness (A–C) and diversity (D–F) were estimated with abundant OTUs obtained with 16S rRNA gene (A and D), gyrB (B and E) and ITS1 sequences (C and F). Richness and diversity associated to uncontaminated seeds (C2013 and C2014), seeds contaminated with Xcc (X2013 and X2014) and seeds contaminated with Ab (A2013 and A2014) were compared. Each sample is represented by a green line, while black line represents the median. The grey area represents the density of distribution. Letters a, b and c denote significant changes between conditions considered at a P-value ≤0.01 (as assessed by ANOVA with post hoc Tukey’s HSD test).

