
Figure 2. Distributions of all reported p-values (white) and exactly reported p-values (blue) across eight psychology journals.
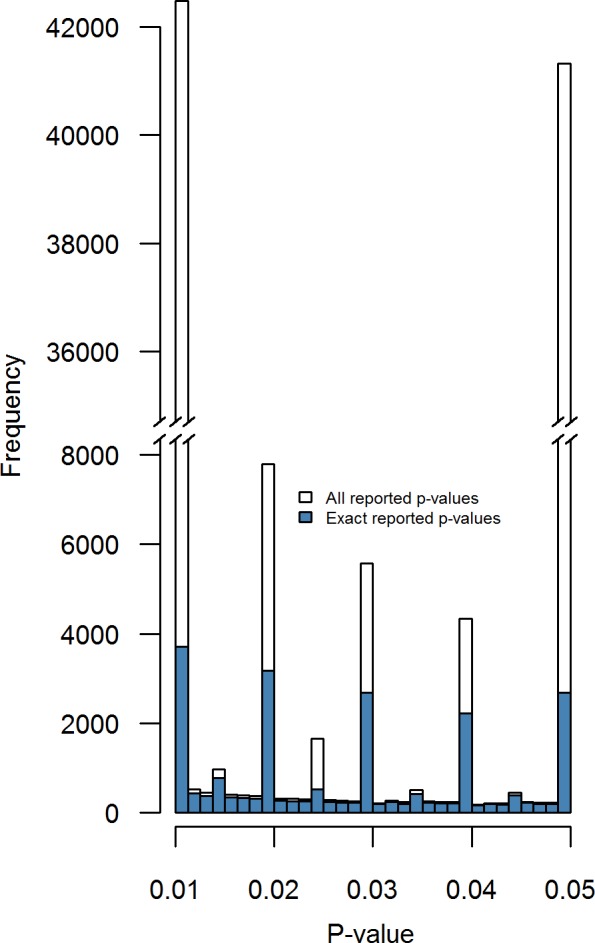
Binwidth = .00125.
Official websites use .gov
A
.gov website belongs to an official
government organization in the United States.
Secure .gov websites use HTTPS
A lock (
) or https:// means you've safely
connected to the .gov website. Share sensitive
information only on official, secure websites.
Binwidth = .00125.