
Figure 3. Distribution of recalculated p-values where the p-value is reported as p = .05.
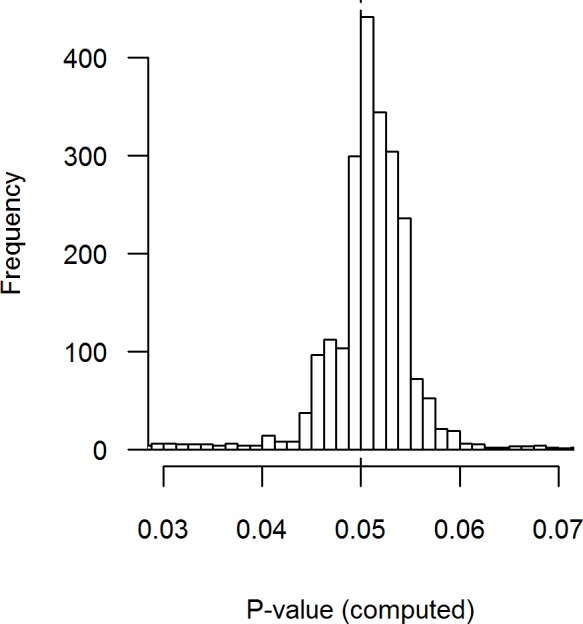
9.7% of the results fall outside the range of the plot, with 3.6% at the left tail and 6.1% at the right tail. Binwidth = .00125
Official websites use .gov
A
.gov website belongs to an official
government organization in the United States.
Secure .gov websites use HTTPS
A lock (
) or https:// means you've safely
connected to the .gov website. Share sensitive
information only on official, secure websites.
9.7% of the results fall outside the range of the plot, with 3.6% at the left tail and 6.1% at the right tail. Binwidth = .00125