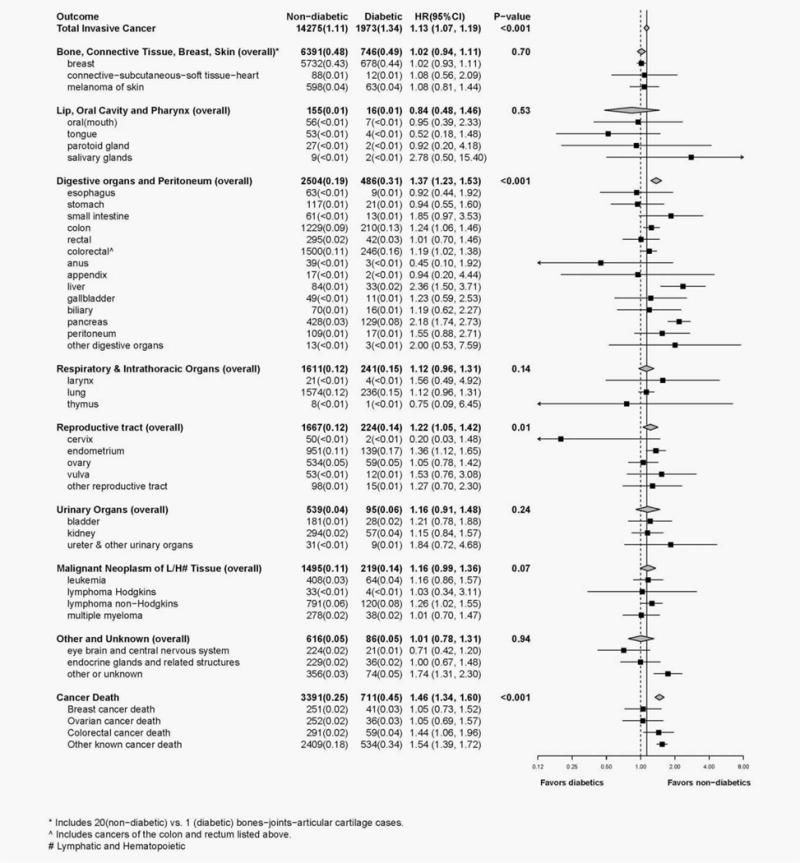
Figure 1.

Forest plot displays number of cases, annualized percentages and multivariable adjusted hazard ratios (95% CI) for the risk of cancer associated with diabetes status (participants with diabetes vs. participants without diabetes). Hazard ratios were obtained from Cox proportional hazards models that were adjusted for the baseline covariates of age, race/ethnicity, education, smoking, physical activity, aspirin use, history of hyperlipidemia, duration of HT use, BMI and WHR; baseline hazard functions were allowed to vary by age (10-year group), study participation (four hormone therapy trial randomization arms, the dietary trial randomization arms, or enrollment into the OS), hysterectomy status and enrollment in WHI extensions (I/II; time-dependent). Diabetes status was modeled as a time-dependent exposure variable and participants were censored if their medication inventory became out-of-date (i.e., more than 3.5 years old); participants were allowed to re-enter the model upon completion of a current medication inventory. P-values, for the ten summary endpoints, correspond to a 1 degree-of-freedom test of significance for the estimated hazard ratios.
