
Figure 2.
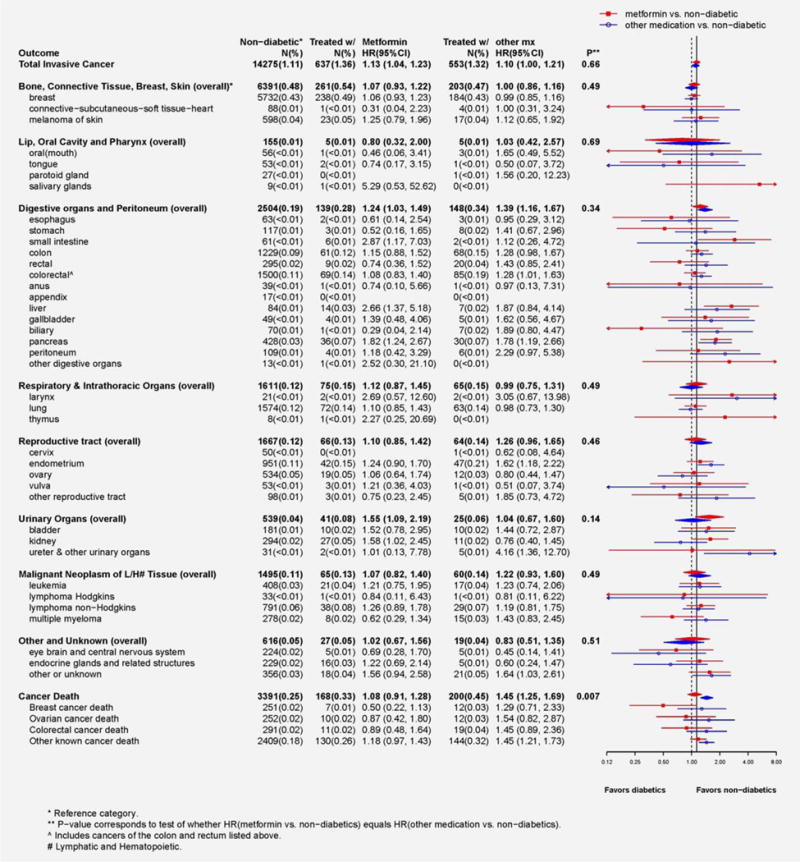
Forest plot displays number of cases, annualized percentages and multivariable adjusted hazard ratios (95% CI) for the risk of cancer associated with diabetes treatment (users of metformin vs. participants without diabetes; users of other known non-metformin anti-diabetes medications vs. participants without diabetes). Hazard ratios were obtained from multivariable adjusted Cox proportional hazard models that were described above. P-values, for the ten summary endpoints, correspond to a 1 degree-of-freedom test of significance for whether the estimated hazard ratios differ.