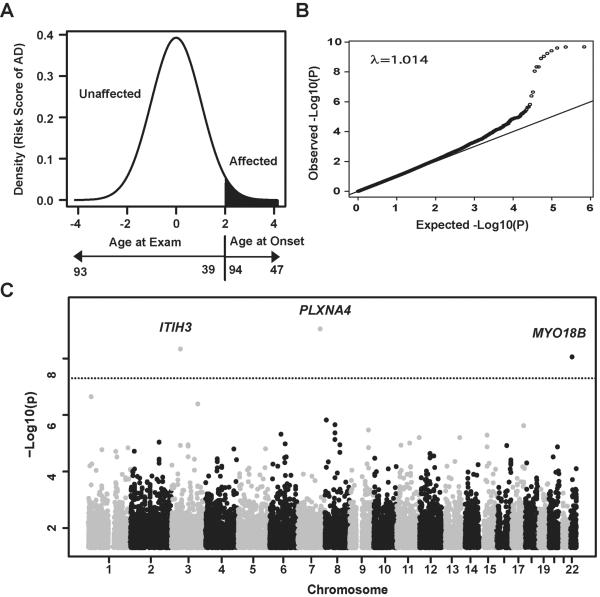
Fig 1. Genome-wide association analysis in the Framingham Heart Study.
(A) Ranked risk score distribution. Liability scores after adjusting for age and sex in a logistic regression model were rank-transformed and analyzed as a quantitative trait. Areas with red indicate distribution of risk (liability) rank of AD cases based on age at onset. Black arrow for age at exam from controls and red arrow for age at onset from AD cases indicate ranks of risk scores. The curve shows younger unaffected subjects have higher risk to develop AD than older unaffected subjects, and AD cases with earlier onset have greater liability than cases with older onset. (B) Quantile-quantile plot. Observed P values (Y-axis) were plotted against expected P values (X-axis). Black dots represent P values for all genotyped SNPs. (C) Manhattan plot. Association results for genotyped SNPs. P-values are expressed as −log10(P) (y-axis) for every tested SNP ordered by chromosomal location (x-axis). Genome-wide significance level is shown as a dotted line at P=1.4×10⁻⁷.

