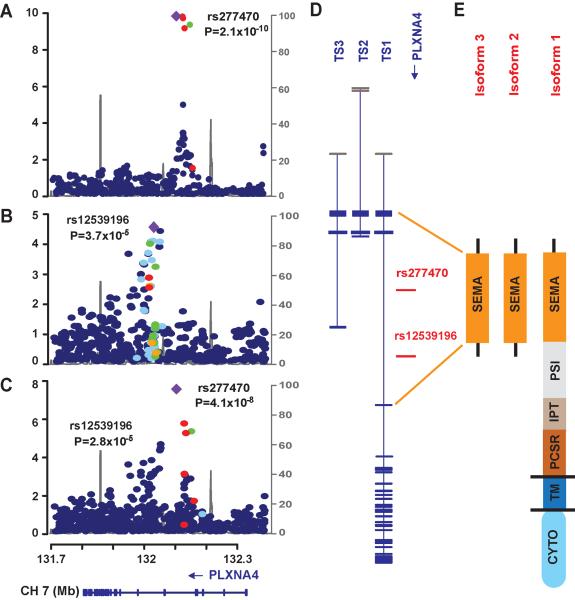
Fig 3. Genetic findings in the PLXNA4 region.
Regional association plots of genotyped and imputed SNPs from the FHS (A) and NIA-LOAD (B) datasets, and in meta-analysis (C). Most significant SNPs in the FHS (rs277470) and NIA-LOAD (rs12539196) datasets are indicated by purple diamonds. P-values are expressed as −log10(P) (y-axis) for every tested SNP ordered by chromosomal location (x-axis). Estimates of linkage disequilibrium (r2) of SNPs in this region with the top SNP computed using 1000 Genomes (hg19/Nov2010EUR) are shown as orange circles for r2 ≥ 0.8, yellow circles for 0.5 ≤ r2 < 0.8, light blue circles for 0.2 ≤ r2 < 0.5, and blue circles for r2 < 0.2. Recombination rates (scale on right axis) are plotted with a solid gray line. Genomic structure of PLXNA4 was determined using the NCBI database (Build 37.1). (D) Relative position of the most significantly associated SNPs in FHS and NIA-LOAD datasets in the three validated transcripts (TS1, TS2, and TS3). Exons are denoted with horizontal bars. (E) Diagrams of functional domains encoded by amino acids from the full-length (TS1) and the shorter (TS2 and TS3) transcripts. SEMA: sema_plexinA1 interacting module (exon 1–4 in TS1 and exon 1–3 in TS2 and TS3); PSI: plexin repeat (exon 4–11 in TS1); IPT: three repeats of the binding domains of plexins and cell surface receptors (exon 11–17 n TS1); PCSR: binding domain of plexins and cell surface receptors (PCSR) and related proteins (exon 17–19 in TS1); TM: transmembrane region (exon 19 in TS1); CYTO: cytoplasmic domain (exon 20–31 in TS1).

