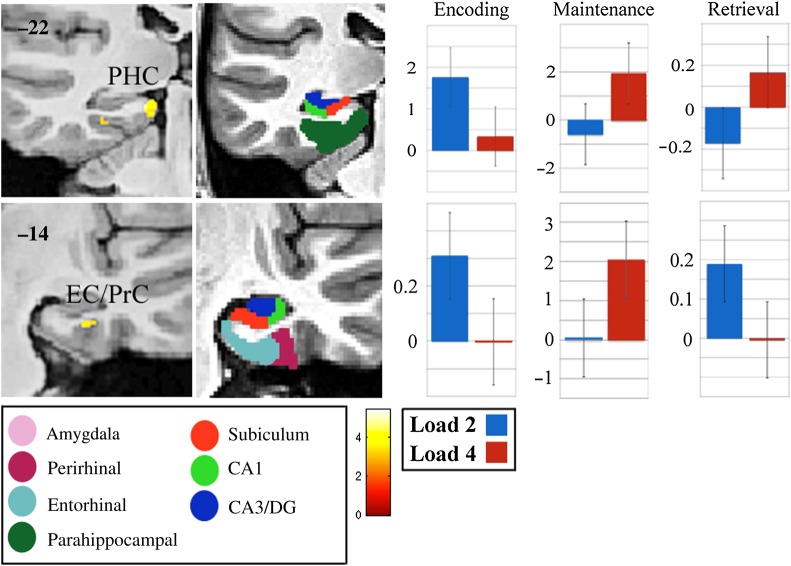
Figure 3.
The entorhinal, perirhinal, and parahippocampal cortices show functional contribution while maintaining a greater WM load (Load 4 > Load 2; maintenance). The picture shows statistical parametric maps for group-level activity superimposed on the representative structural template image, the corresponding segmented image, and graphs showing parameter estimates (beta weights) for Load 2 (blue) and Load 4 (red) for encoding, maintenance, and retrieval (test) phases. The model segmentation is displayed to indicate the location of CA1 (light green), the subiculum (red), EC (light blue), PrC (violet), and PHC (dark green). Note that numbers correspond to y-coordinates, that is, the distance of each slice from the anterior commissure in millimeter (AC, y = 0 mm in Talairach coordinates; that is, regions posterior to the AC have negative y-values) and are indicated for each slice. Note that the coordinates describe a subject-specific space and are not in MNI or Talairach space. Images are displayed in “radiological” convention, with the right hemisphere displayed on the left side of the image.

