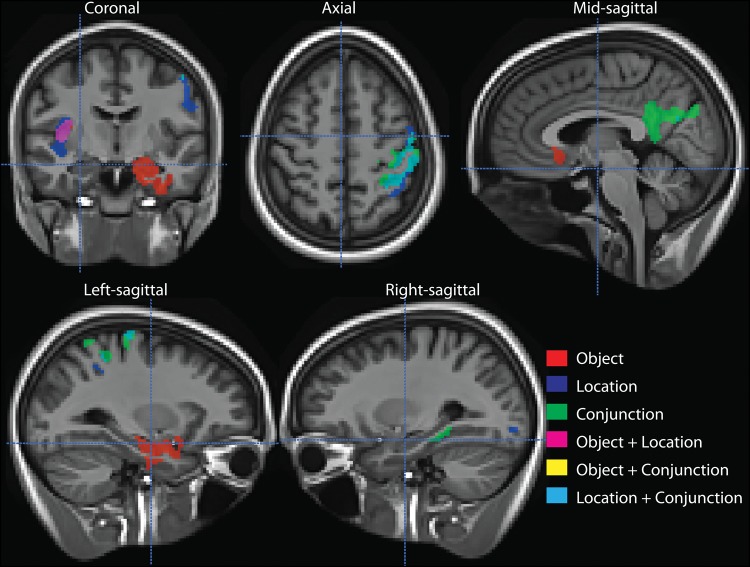
Figure 1.
Significant clusters of positive correlation between cortical thickness and performance in respective cognitive tasks among all participants. Colors indicate individual task correlations and overlapping voxels between clusters of pairs of tasks. Note that there is no yellow voxels indicating no overlap between the object and conjunction conditions. All clusters are corrected at FWER P < 0.05.

