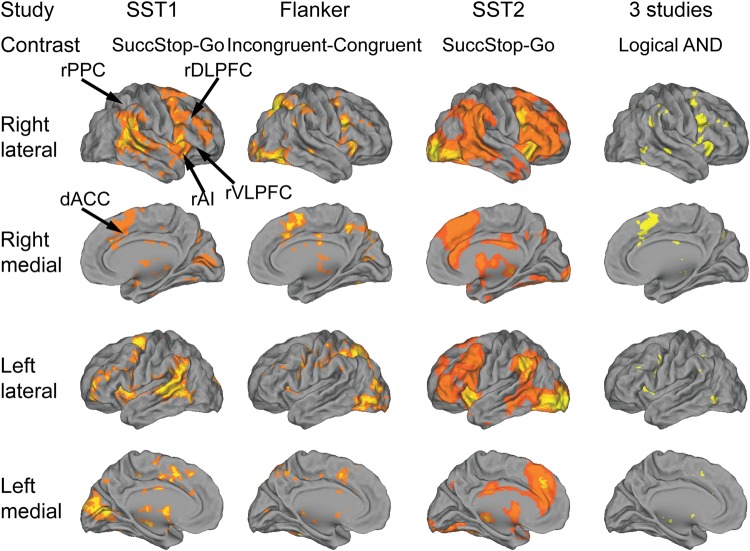
Figure 3.
Brain areas activated during the three cognitive control tasks. The first 3 columns show Frontal-Cingulate-Parietal activation in the three studies. All contrast maps were thresholded at P < 0.05, FDR corrected for multiple comparisons. The rightmost column shows the overlapped suprathreshold activation in all three studies identified using logical “AND” operation.

