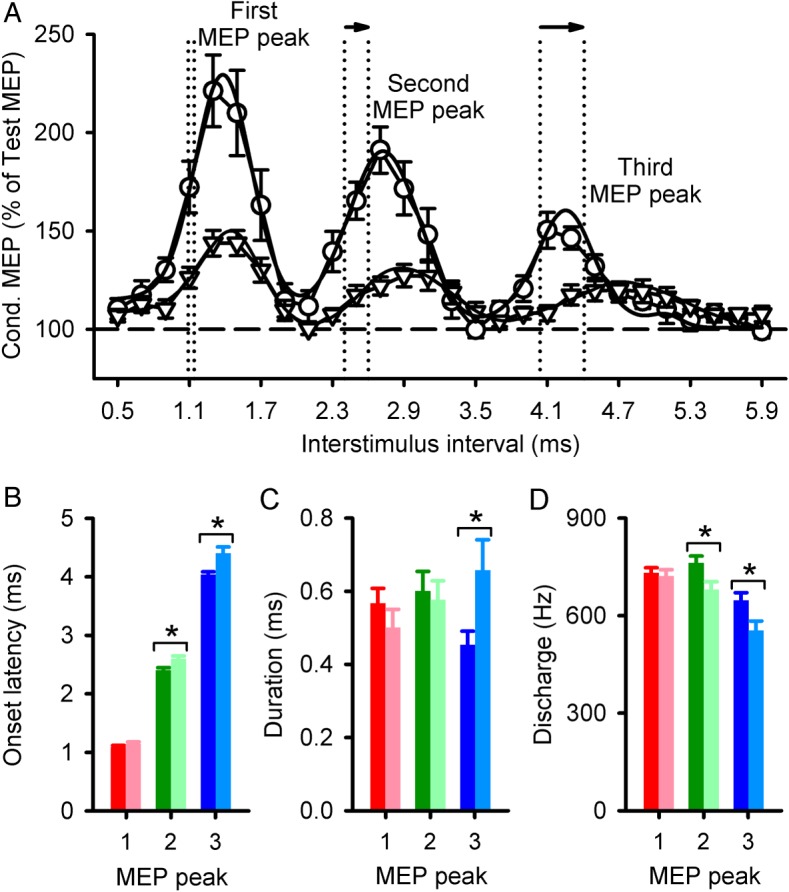
Figure 3.

MEP peaks onset latency and duration estimated by a Gaussian model. (A) Data estimated by a Gaussian model for each peak in controls (circles) and subjects with SCI (triangles). Each symbol shows the group mean of conditioned MEPs (expressed as a % of the Test MEP), with the solid line representing the respective curve fit. The vertical dotted lines indicate the onset localized by the fitting model. Note the delayed onset, as shown by the arrows, in SCI subjects compared with controls for the second and third MEP peak. The horizontal dashed line represents the size of the Test MEP. Group data (Controls, n = 14; SCI, n = 12) showing onset latency (B), duration (C), and discharge frequency (D) of each peak. The abscissa shows each MEP peak (1, 2, and 3). The ordinate shows the onset and duration (milliseconds), and discharge frequency (Hz) of each peak in SCI subjects (light bars) and controls (dark bars). Error bars indicate SEs. *P < 0.05.
