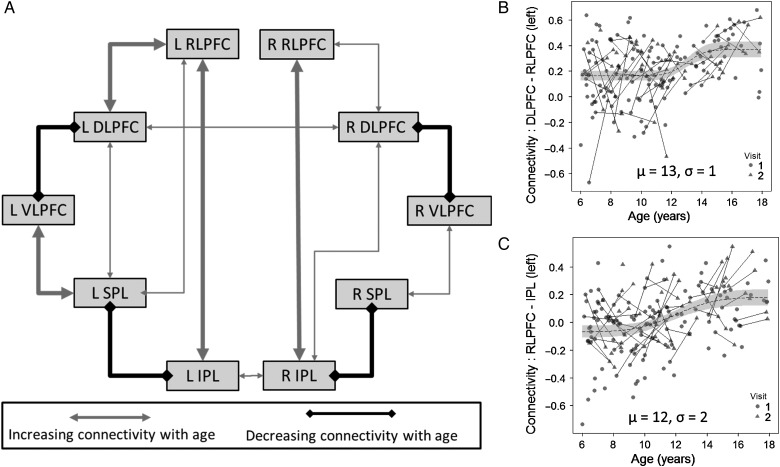
Figure 3.
(A) Age-related differences in functional connectivity within the reasoning network. Regions are connected here if they demonstrated a significant pattern of age-related changes (calculated using nonlinear mixed modeling). Thin lines indicate P < 0.05 uncorrected for multiple comparisons, thick lines indicate P < 0.05 Bonferroni-corrected. (B) Scatter plot of the relationship between age left DLPFC-RLPFC connectivity. (C) Scatter plot of the relationship between age and left RLPFC-IPL connectivity.

